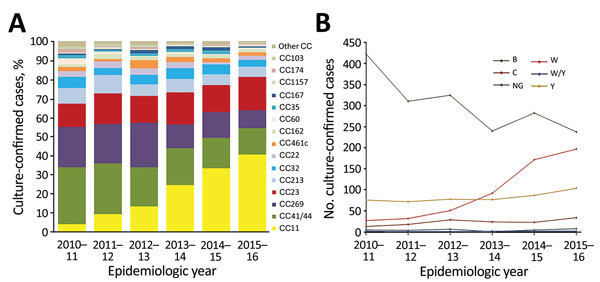
Figure 1.

Clonal complex and serogroup distribution of invasive meningococcal disease isolates, United Kingdom, 2010–2016. A) Proportional contribution of each cc of disease-causing culture-confirmed meningococcal isolates by epidemiologic year. Other cc indicates ccs that were found in <20 isolates during the 6-year study period. B) Distribution of isolate serogroups by epidemiologic year. Serogroups shown had >10 isolates during the 6-year study period. Serogroups with <10 isolates (A, E, X, and Z) are shown in Table 1. CC, clonal complex; NG, nongroupable, W/Y, serogroups combined because of inconclusive serogrouping results.
