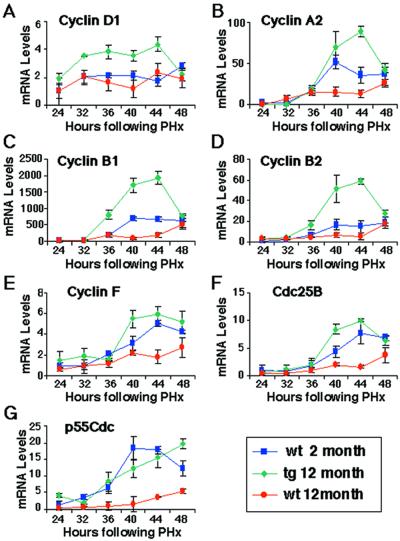
Figure 4.
Graphic presentation of normalized mean mRNA levels (±SD) of cell cycle regulatory genes. Shown are mean mRNA levels of cyclin D1 (A), cyclin A2 (B), cyclin B1 (C), cyclin B2 (D), cyclin F (E), Cdc25B (F), and p55cdc (G) at various intervals in regenerating liver (in triplicate). The regenerating liver was obtained from 2-month-old wt mice (blue), 12-month-old tg mice (green), or 12-month-old wt mice (red). Expression levels of cell cycle regulatory genes were normalized to the GAPDH mRNA levels. The expression level of the 2-month-old regenerating mouse liver at 24 h after PHx was set at 1.0.

