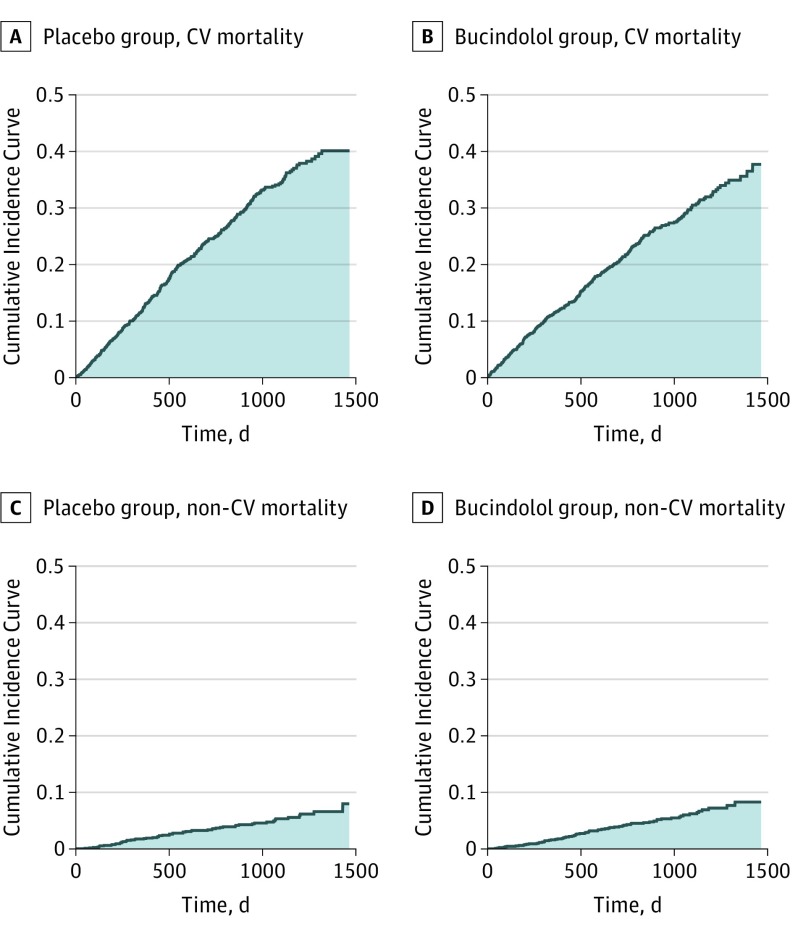
Figure 2. Mean Time Lost Due to Cardiovascular (CV)-Related and Non–CV-Related Mortality in 48 Months for Bucindolol and Placebo.
The area under the cumulative incidence curve for CV-related mortality from baseline up to 48 months represents the restricted mean time lost (RMTL) due to CV mortality for the placebo group (shaded area, 342.3 days) (A) and for the bucindolol group (shaded area, 302.9 days) (B). The area under the cumulative incidence curve for non–CV-related mortality represents the RMTL due to non-CV mortality for the placebo group (shaded area, 52.0 days) (C) and for the bucindolol group (shaded area, 59.5 days) (D).

