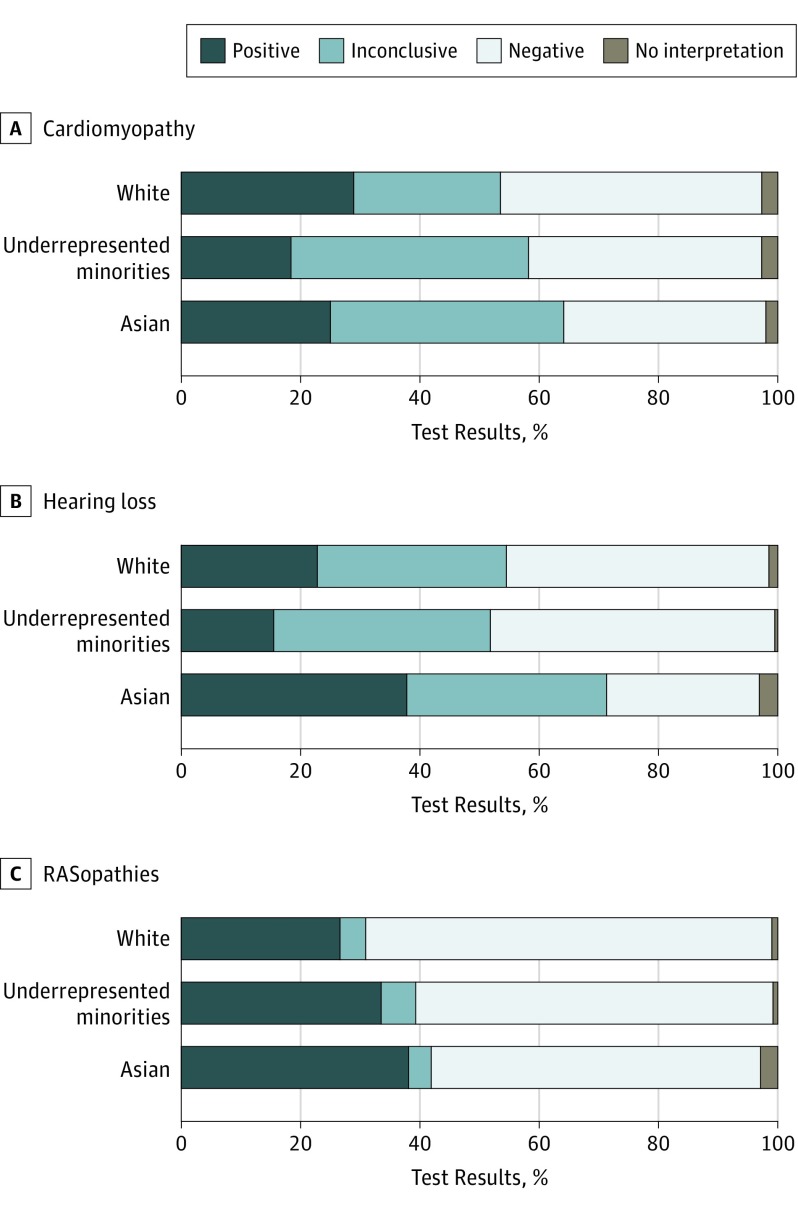
Figure. Genetic Testing Results by Racial/Ethnic Group.
A, Percentages of people of white, Asian, and underrepresented minority (URM) backgrounds with positive, inconclusive, or negative test results for cardiomyopathy. The difference between positive results in the white and URM groups was significant (white: 1314/4539; 29.0% vs URM: 155/842; 18.4%; χ21 = 39.8; P < .001). B, Percentages of people of white, Asian, and URM backgrounds with positive, inconclusive, or negative test results for hearing loss. Significant differences were found between positive results in the white and URM groups (white: 360/1579; 22.8% vs URM: 72/465; 15.5%; χ21 = 11.5; P = .001) and the white and Asian groups (white: 360/1579; 22.8% vs Asian: 62/164; 37.8%; χ21 = 18.2; P < .001). C, Percentage of people of white, Asian, and URM backgrounds with positive, inconclusive, or negative test results for RASopathies. Significant differences were found between positive results in the white and URM groups (white: 502/1887; 26.6% vs URM: 128/382; 33.5%; χ21 = 7.6; P = .01) and the white and Asian groups (white: 502/1887; 26.6% vs Asian: 40/105; 38.1%; χ21 = 6.6; P = .01).

