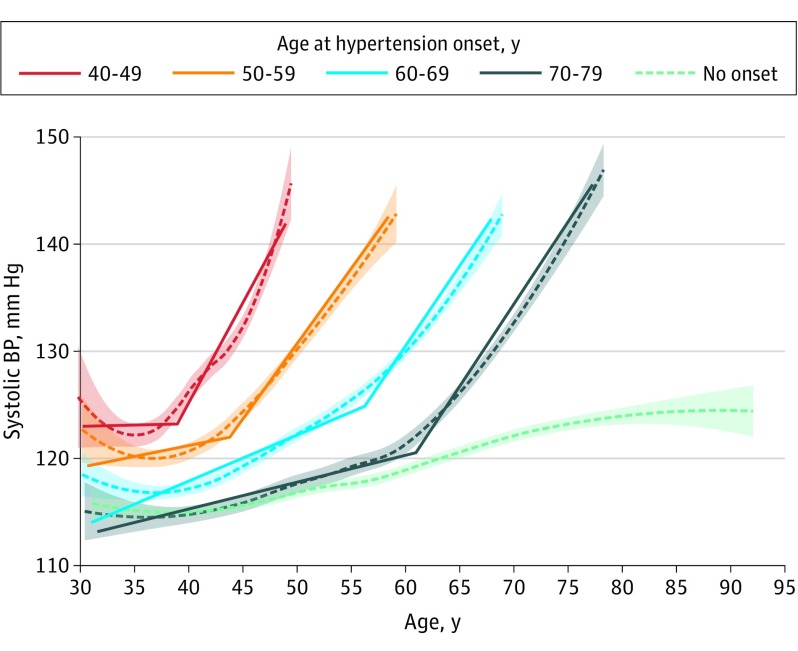
Figure 2. Observed Blood Pressure Trajectories Preceding Hypertension in the Framingham Heart Study Original Cohort.
Longitudinal analyses, including a piecewise segmented linear model (solid lines), identified systolic blood pressure change points (labeled) for participants across categories of hypertension onset age. Also shown are restricted cubic splines (dashed lines), with 95% confidence intervals derived from associating age with systolic blood pressure, without modeling to identify change points; all splines and regression lines are truncated at the 2.5th and 97.5th percentiles of the age distribution for each hypertension age of onset category.

