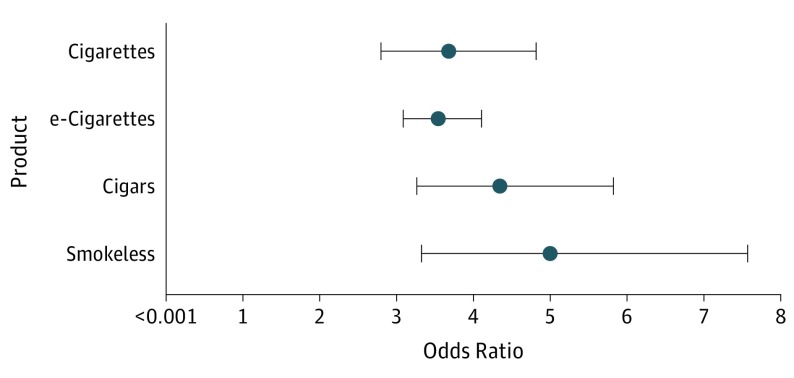
Figure. Susceptibility to Use of a Tobacco Product in Respondents Aged 12 to 17 Years at Wave 1 and Ever Use of the Product at Wave 2 in the Population Assessment of Tobacco and Health Study.
Adjusted odds ratios for ever use of product at wave 2. Adjusted for age, sex, race/ethnicity, and exposure to tobacco users. Vertical bar is a visual reference to the odds ratio = 1.0 line; when confidence limits (CLs) cross this line, they are not significantly different from the reference. Error bars indicate 95% CLs.

