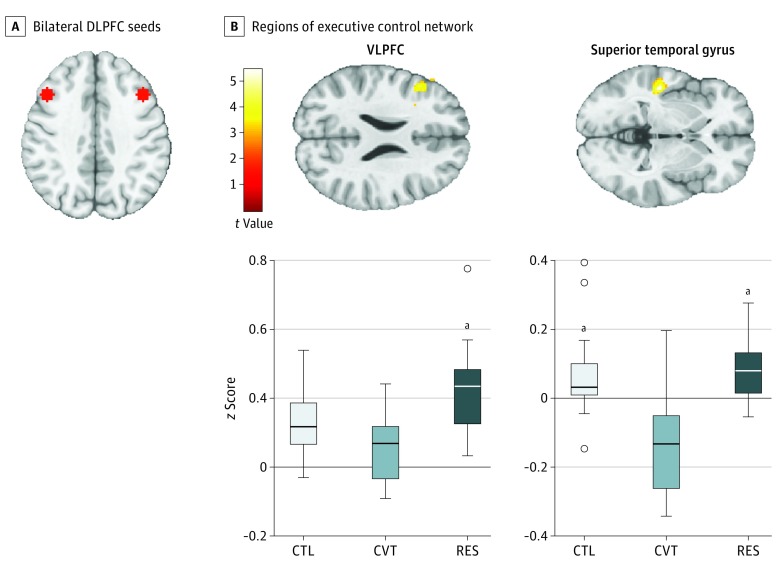
Figure 3. Executive Control Network Connectivity.
A, Bilateral DLPFC seeds (coordinates in Montreal Neurological Institute space: left: -43, 22, 34; right: 43, 22, 34). B, Regions of executive control network (DLPFC seeds) that exhibited greater connectivity within the RES compared with CVT and CTL groups. Color bar represents t values from the between-group paired t tests. B, Box-and-whisker plot of functional connectivity quantified as z scores for CTL, CVT, and RES groups. The horizontal line in the middle of each box indicates the median, while the top and bottom borders mark the 75th and 25th percentiles, respectively. The whiskers above and below the box mark the 90th and 10th percentile. The points beyond the whiskers are outliers. CTL indicates control; CVT, converted; DLPFC, dorsolateral prefrontal cortex; RES, high-risk resilient; and VLPFC, ventrolateral prefrontal cortex.
aP < .001 compared with CVT.

