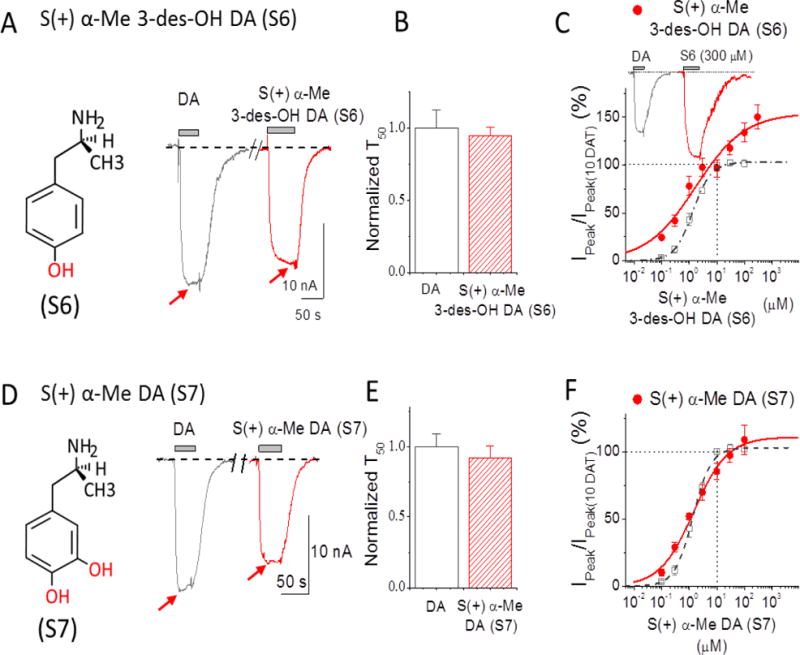
Figure 5. Depolarizing currents for the S(+)AMPH derivatives: S(+)α–Me 3-des-OH-DA (S6) and S(+)α–Me DA (S7).

(A) 10 μM S(+)α-Me 3-des-OH-DA (red) compared to 10 μM DA (grey). The inset shows the structure of S(+)α-Me 3-des-OH-DA with one hydroxyl group (red) added to S(+)AMPH at the 4-position 4. S(+)α-Me 3-des-OH-DA showed similar potency when compared to DA and the current returned to baseline upon its removal. (B) Recovery time constants at −60 mV show no significant differences; rates were normalized to the equivalent experiment of 10 μM DA response in the same cell. Data points represent mean ± S.E., n = 4-5. (C) Dose-response for S(+)α-Me 3-des-OH-DA (red) at −60 mV. Points were normalized to DA response at 10 μM DA in the same cell. Solid line is fit to the Hill equation with n = 0.49 ± 0.05, EC50 = 1.72 ± 0.38 μM for S(+)α-Me 3-des-OH-DA, n = 3-6. (D) 10 μM S(+) α-Me DA (S7) (red) compared to 10 μM DA (Grey). The inset on the left shows the structure of S(+)α-Me DA with two hy-droxyl groups (red) added in S(+)AMPH at positions of 3 and 4. 10 μM R(−) α-Me DA showed significant less potency than 10 μM DA, but current returned to baseline after removal. (E) Recovery rates at −60 mV after removing 10 μM DA or S(+)α-Me DA, rates were normalized to the response of 10 μM DA in the same cell. Data points represent mean ± S.E., n = 5-6. (F) Dose response for S(+)α-Me DA (red) normalized to 10 μM DA in the same cell. Hill equation fit gave: n = 0.71 ± 0.11, EC50 = 1.45 ± 0.50 μM for S(+)α-Me DA, n = 4-6. Note: T50 in B and E represent the time constant required to reach 50% of the recovery upon removal of the compound. For comparison, the dose-response for DA in Figure 1D is also shown in dashed lines in C and F. Arrows indicate peak depolarization upon addition of the compounds.
