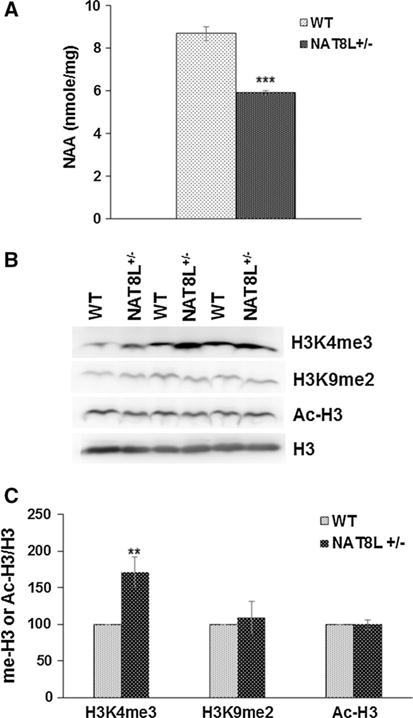
Fig. 6.

Reductions in NAA in vivo result in increased levels of H3K4me3. a Bar diagram showing NAA concentration is decreased in NAT8L+/− mice as compared to WT mice (n = 3). b Representative Western blots for H3K4me3, H3K9me2, acetylated histone H3 (Ac-H3), and histone H3 from white matter of 1-year-old WT and NAT8L+/− mice. c Bar diagram showing the densitometry analysis for H3K4me3/H3K9me2/Ac-H3 normalized to H3 levels. Error bars represent SEM. **p ≤ 0.01, ***p ≤ 0.001
