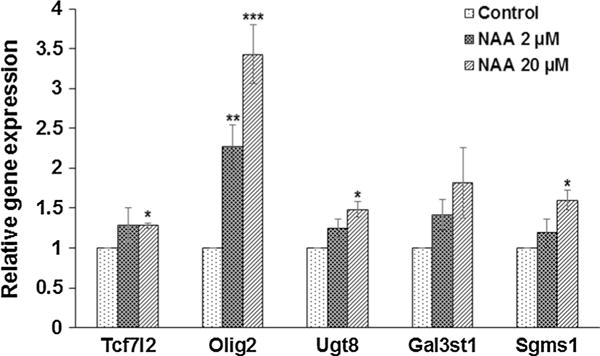
Fig. 7.

NAA increases mRNA expression of genes related to oligodendrocyte differentiation and myelin lipid synthesis. Bar diagrams showing the differential expression of TCF7l2, Olig2, Ugt8, Gal3st1, and Sgms1 in primary culture of oligodendrocyte treated with 0, 2, and 20 μM of NAA. Data were normalized with respect to β-actin. Relative gene expression data are shown relative to controls, which are adjusted to 1. Error bars represent SEM. *p ≤ 0.05, **p ≤ 0.01, ***p ≤ 0.001
