
Figure 4.
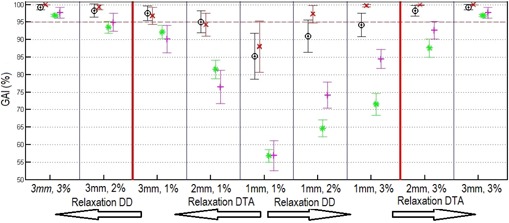
GAI for the four comparisons, as an average of both phantoms and the four energies. The red × = the Conventional‐GAI, the black circles = the TPS Phantom GAI, the green stars = the Anatomy Phantom GAI, and the pink crosses = the Anatomy GAI for the different DTA and DD. From the center to the right, the big red line is a relaxation of the DD and to the left, the red line is an relaxation of the DTA. Error bars are the standard deviation.