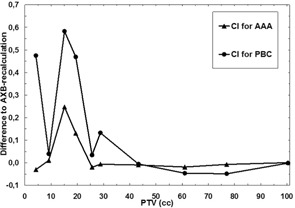
Figure 5.

Comparison of the results for the algorithms as a function of the PTV size. Solid line with triangles represents the difference in CI between the AAA and the AXB‐recalculated AAA plan, and solid line with circles represents the differences for the CI between the PBC algorithm and the AXB‐recalculated PBC plan. The reader should note the absolute scale used.
