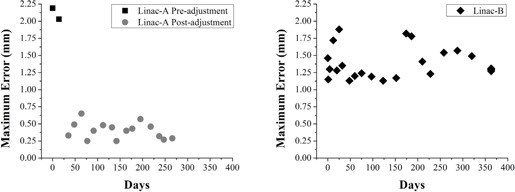
Figure 4.

Maximum rotational error relative to MV isocenter over time. The Linac‐A table (left) before and after adjustment. The table exhibits stable performance for several months postadjustment. The Linac‐B table (right) does not exhibit significant trends from time of commissioning, but is characterized by greater standard deviation.
