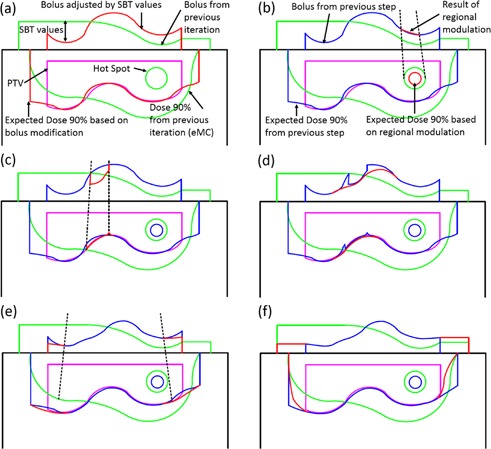
Figure 3.

Schematic representation of bolus design algorithm after first iteration. The green lines indicate the previous iteration's bolus and corresponding 90% isodose line which does not yet conform well to the PTV (magenta) in this example. The red lines show the bolus shape modified by the current step (a‐f) (i.e., change in thickness by SBT value or a regional modulation operator), as well as the effect of this change on the dose distribution. For reference, blue lines denote the bolus shape and 90% isodose line from the previous step. Hot spots are indicated as circles. The individual steps are: (a) estimation of the bolus thickness based on SBT values, (b) smoothing for hot spots, (c) smoothing for dose coverage, (d) smoothing for surface irregularity, (e) adjustment at PTV margin and (f) extension outside PTV.
