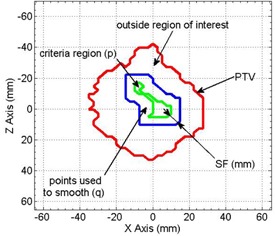
Figure 4.

Schematic representation of regions involved in smoothing (e.g., to alleviate a hot spot). The red line shows the projection of the PTV onto the calculation plane. The green line denotes the region of interest satisfying the hot spot criterion and containing points, p, that will be adjusted. Points q between the blue and green lines are included in the smoothing operation, but are not adjusted.
