Figure 10.

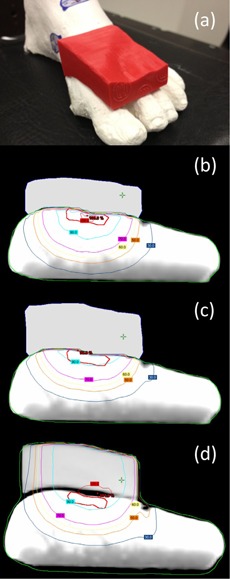
Picture of foot phantom (a) with bolus added on the surface. Isodose plot of (b) conventional plan using 1 cm bolus, (c) MERT plan using optimized bolus, and (d) MERT verification plan using bolus printed by the standard print profiles.

Picture of foot phantom (a) with bolus added on the surface. Isodose plot of (b) conventional plan using 1 cm bolus, (c) MERT plan using optimized bolus, and (d) MERT verification plan using bolus printed by the standard print profiles.