
Figure 3.
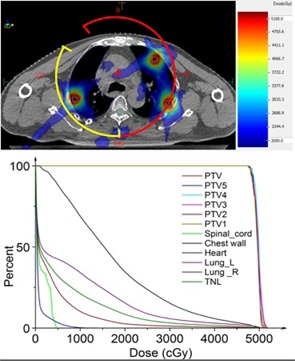
(Upper) The dose distribution on one traverse slice (Patient A with five metastases). The red and yellow arcs represent the fields; the red “+” is the isocenter of the fields; the cyan outlines represent the targets on this slice. (Lower) The plan DVH for Patient A. , PTV was the sum of all PTVn; , meaning the volume ; .