Figure 5.

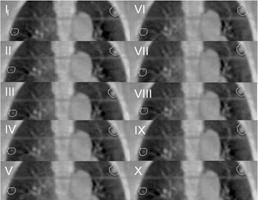
The result of image matching between the planning CT and ten phases of 4D CBCT (Patient A). The contours represent the PTV.

The result of image matching between the planning CT and ten phases of 4D CBCT (Patient A). The contours represent the PTV.