Figure 2.

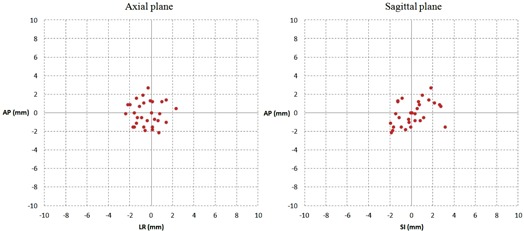
Scatter plot of points representing the values of the difference between the two reference observers respectively on the sagittal and axial plane.

Scatter plot of points representing the values of the difference between the two reference observers respectively on the sagittal and axial plane.