
Figure 2.
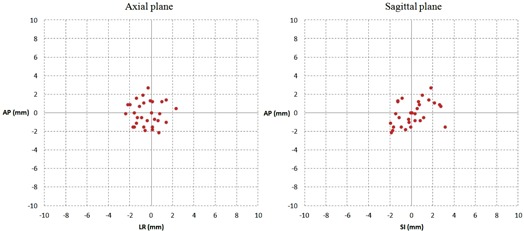
Scatter plot of points representing the values of the difference between the two reference observers respectively on the sagittal and axial plane.
Official websites use .gov
A
.gov website belongs to an official
government organization in the United States.
Secure .gov websites use HTTPS
A lock (
) or https:// means you've safely
connected to the .gov website. Share sensitive
information only on official, secure websites.
Scatter plot of points representing the values of the difference between the two reference observers respectively on the sagittal and axial plane.