Figure 3.

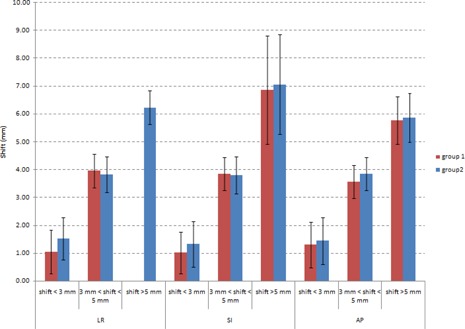
Histogram of mean deviations of each group analyzing three classes of shift; all different directions were analyzed and standard deviation for each bar is reported.

Histogram of mean deviations of each group analyzing three classes of shift; all different directions were analyzed and standard deviation for each bar is reported.