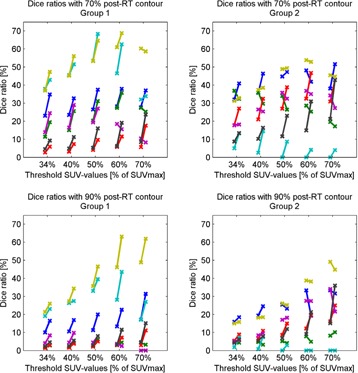
Figure 3.

Dice overlaps ratio of FDG uptake areas. For each patient (represented by different colors) paired values are plotted, before (left cross in the pair) and after (right cross) deformable registration for Group 1 and 2, connected by a line. Left, top to bottom: DRs of the (deformed) pre‐RT contours with the 70% and 90% of contours in the post‐RT scan for Group 1. Right, top to bottom: DRs of the (deformed) pre‐RT contours with the 70% and 90% of contours in the post‐RT scan for Group 2.
