Figure 5.
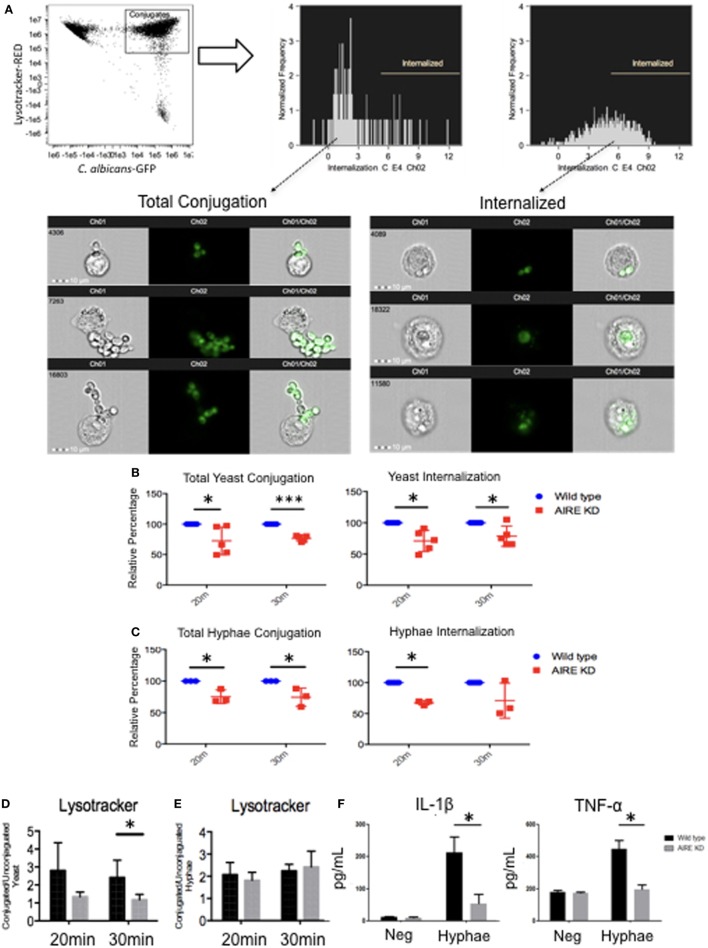
Candidacidal activity in wild-type and AIRE-knockdown macrophage-like THP-1 cells. Wild-type and AIRE-knockdown macrophage-like THP-1 cells were stimulated with yeast [multiplicity of infection (MOI 1:2)] (B) or hyphae (MOI 2:1) GFP C. albicans (C) for 20 or 30 min. (A) Image Stream analysis of fungal phagocytosis by macrophages. GFP fluorescence intensities were gated for further analysis. The cells were divided into subpopulations according to the GFP maximum pixels. Internalization gate was performed for cells incubated with yeast or hyphae at 4°C. Each dot represents one independent experiment used for the measurement indicated. Wild-type (blue circle) and AIRE-knockdown macrophage-like THP-1 cells (red square). (D,E) Measurement of cytoplasm acidification in wild-type and AIRE-knockdown macrophage-like THP-1 cells stimulated with yeast (MOI 1:2) (D) or hyphae (MOI 2:1) (E) for 20 or 30 min by Image Stream analysis. Representative images of five independent experiments are shown. (F) IL-1β and TNF-α secretion in supernatants from resting and hyphae-stimulated cells. Wild-type (black bar) and AIRE-knockdown (gray bar) macrophage-like THP-1 cells were stimulated with hyphae (MOI 2:1) for 6 h. The horizontal bars denote the mean. Representative graph of three independent experiments. *p < 0.05 as determined by the t-test.

