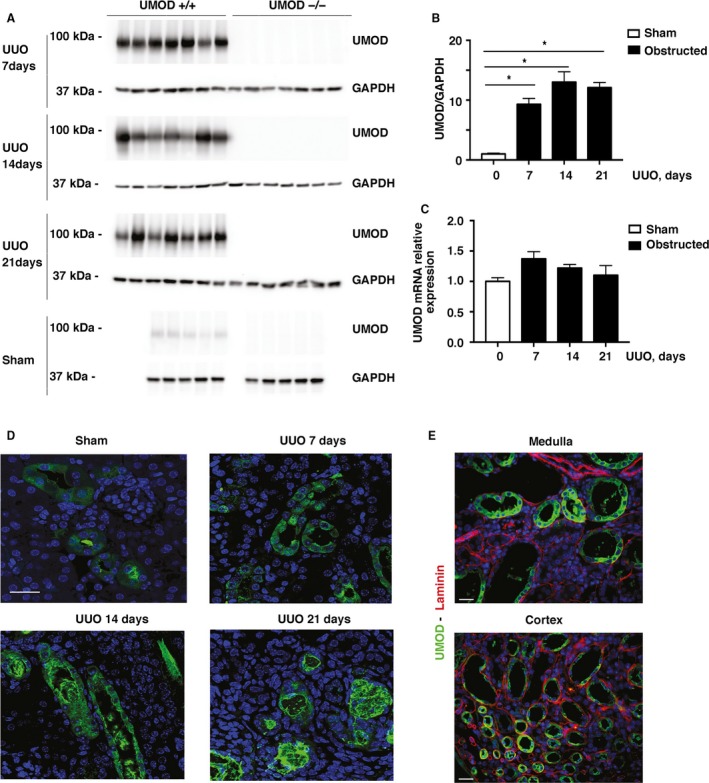
Figure 1.

Kidney UMOD protein levels increase in UUO‐induced injury. Total kidney UMOD protein levels increased significantly 7, 14, and 21 days after UUO (n = 7/group) compared with the sham group (n = 5/group) in the UMOD+/+ mice, as measured by western blotting (A). UMOD protein was not detected in any of the UMOD‐/‐ mice. Mean levels + 1SEM shown in bar graphs were calculated after loading correction using GAPDH levels (B). * indicates a P value < 0.05 relative to sham. Kidney Umod mRNA levels measured by real‐time PCR were not significantly different from sham levels at any time‐point after UUO (C). Representative confocal immunofluorescence photomicrographs of the UMOD+/+ kidneys illustrate UMOD protein within tubular epithelia and their adjacent lumina (D). By days 14 and 21, intraluminal deposits are predominant and acquire an organized structural appearance by day 21. Costaining for laminin (red) to delineate tubular basement membranes failed to detect convincing interstitial UMOD deposits (green) by epifluorescence microscopy, as shown on day 14 (E). Magnification: ×100 for confocal and ×40 for nonconfocal microscopy. Scale bars: 25 μm.
