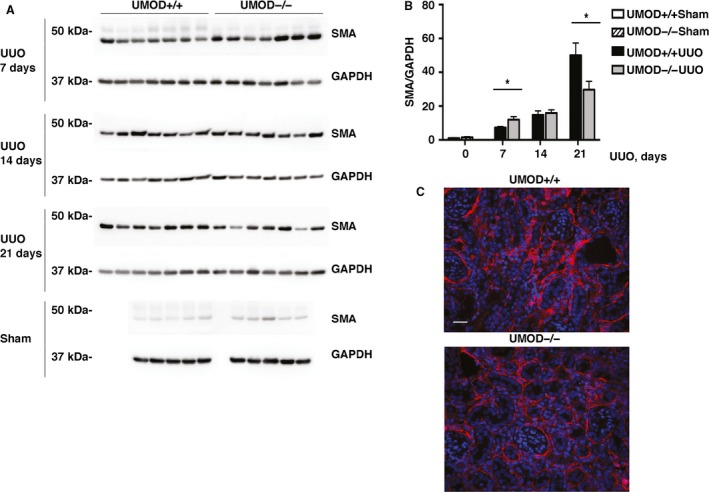
Figure 7.

UMOD effects on interstitial myofibroblasts in UUO nephropathy. The intensity of the interstitial myofibroblast infiltration, evaluated by α SMA western immunoblotting (n = 5 for sham groups; n = 7 for UUO groups), revealed differences in the kinetics of the response, with significantly lower levels on day 7 and higher levels on day 21 in the UMOD +/+ mice (A, B). Representative immunofluorescence photomicrographs illustrate the differences in α SMA staining (red) on day 21, with DAPI nuclear staining in blue (C). Bar graphs represent means +1SEM; * indicates P value < 0.05. Photomicrograph magnification: ×40. Scale bar: 25 μm.
