Figure 8.

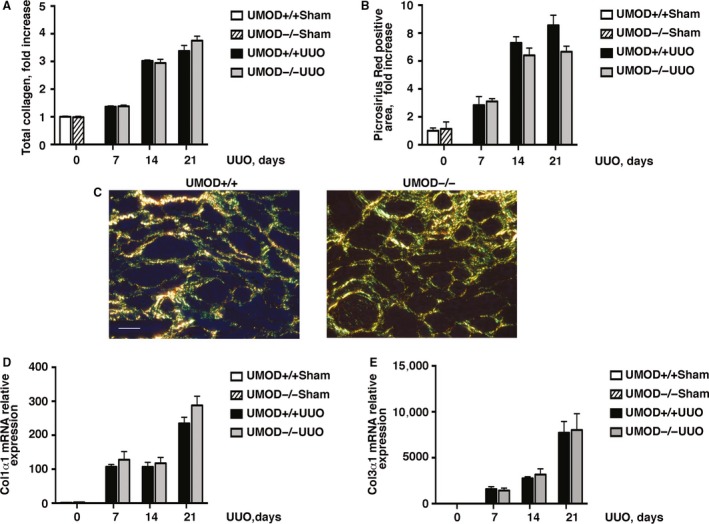
UMOD expression does not alter kidney fibrosis severity in UUO nephropathy. Total kidney collagen levels (μg/mg wet kidney weight) calculated using the hydroxyproline assay and presented as fold increase relative to sham values (A) and picrosirius red+ interstitial areas (B) were similar between the UMOD+/+ and UMOD−/− groups at all time‐points after UUO (n = 10 per group and n = 3–4 per group for the respective methods). Representative polarized light microscopic photomicrographs from day 21 kidney sections illustrate a similar extent of picrosirius red+ interstitial collagen deposits (yellow) (C). Kidney mRNA levels measured by real‐time PCR (n = 3 for sham groups; n = 5 for UUO groups) were similar for procollagen 1α1 (D) and procollagen 3α1 (E). Bar graphs represent means +1SEM. Photomicrograph magnification: ×40. Scale bar: 25 μm.
