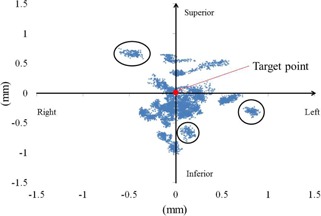
Figure 4.

Laser point distributions around the target point for a stationary case. Blue marks represent laser points detected by the software. The target is shown as a solid red circle. Three black circles present laser point distributions at a certain beam. Although the robot aimed at the target point, deviations of distance were increased with incident beam angles.
