Figure 6.

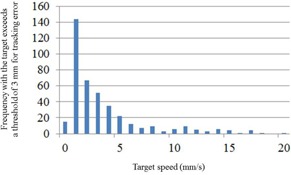
Correlation histograms between target speeds and frequencies of tracking errors for case (B). The vertical axis indicates the frequency with which the target exceeds a tracking‐error threshold of 3 mm.

Correlation histograms between target speeds and frequencies of tracking errors for case (B). The vertical axis indicates the frequency with which the target exceeds a tracking‐error threshold of 3 mm.