
Figure 4.
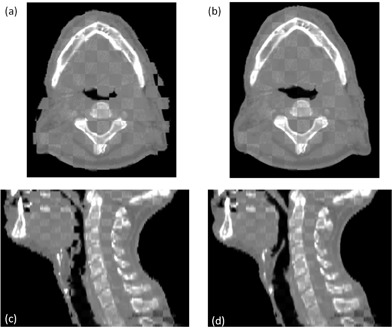
The checker board images of the pCT and CBCT from the second week of the treatment are shown in (a) and (c), respectively. The checker board images of the cCBCT (b) and CBCT (c).
Official websites use .gov
A
.gov website belongs to an official
government organization in the United States.
Secure .gov websites use HTTPS
A lock (
) or https:// means you've safely
connected to the .gov website. Share sensitive
information only on official, secure websites.
The checker board images of the pCT and CBCT from the second week of the treatment are shown in (a) and (c), respectively. The checker board images of the cCBCT (b) and CBCT (c).