
Figure 7.
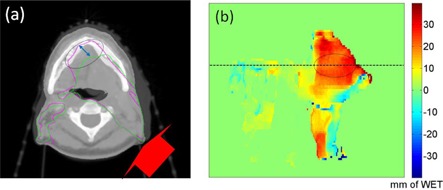
Blended view (a) of the pCT with cCBCT from week 3. The red arrow indicates the direction of the posterior oblique proton beam and the green and magenta contours are the 90% isodose lines for the pCT and cCBCT, respectively. The 2D display (b) of the distal WET difference between the original and new 90% isodose lines in the beam's eye view. The horizontal line indicates the axial slice position of the CT image in (a). Color scale bar is in mm.