
Figure 8.
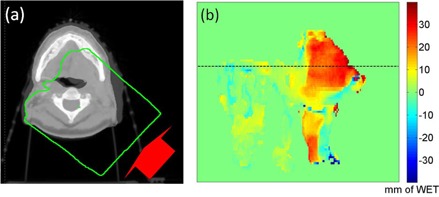
Axial slice (a) indicating the region of PDR calculation (green mask) from the proton source up to the distal 90% dose falloff; (b) beam's eye view PDR difference between the pCT and the cCBCT. The horizontal line indicates the corresponding CT slice in (a). Color scale bar is in mm.