
Figure 10.
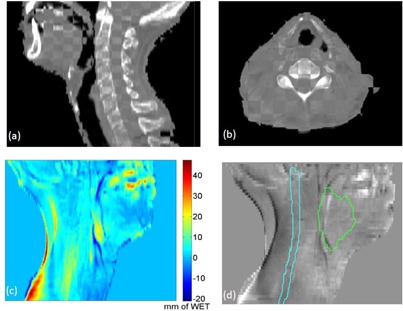
Checker board images of the cCBCT from week 5 and the re‐plan CT acquired on the same day ((a) and (b)). PDR difference (c) with scale bar in mm; (d) no failing points were observed using 3 mm PDR difference and 3 mm search radius within the GTV and cord contours.