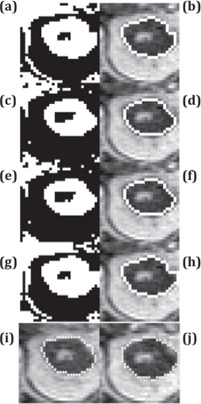
Figure 5.

Kidney segmentation of a sample image frame using five different methods. The left column contains the original segmentation results based on (a) global thresholding, (c) FKM, (e) KHM, and (g) RD‐LSE. In the right column are the corresponding final segmentation results ((b), (d), (f), (h)) after morphological processing. (i) is the first frame with manual contour as a reference where (j) is the deformable registered contour based on VR‐TPDS algorithm.
