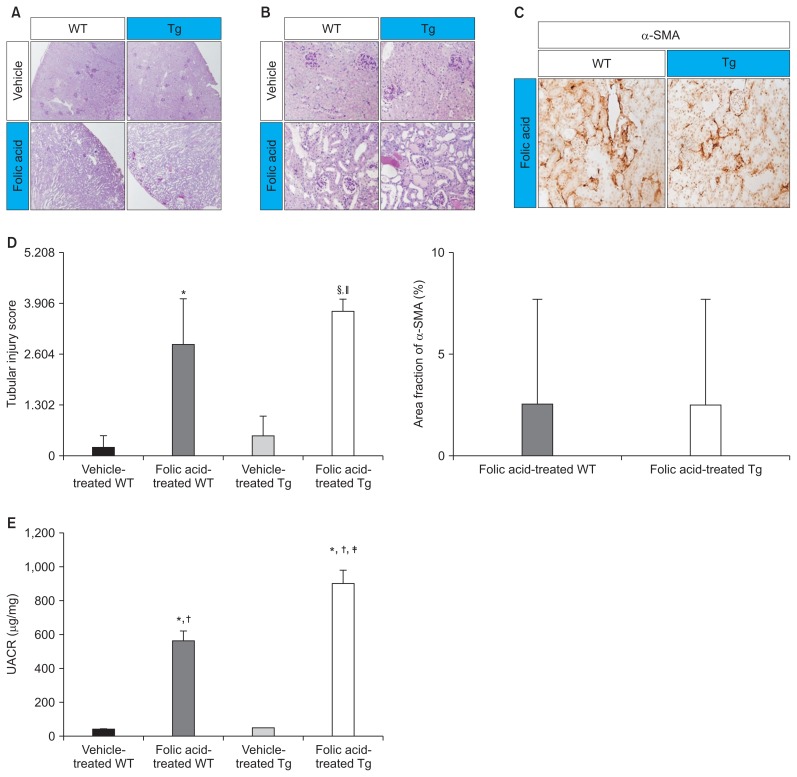
Figure 4. Effects of folic acid on renal histology and albuminuria.
(A) A representative image of PAS staining (×100) showing normal histology of the kidneys of vehicle-treated WT and Tg mice and severely dilated tubules with casts in the kidneys of folic acid-treated WT and Tg mice. (B) A representative image of PAS staining (×400) showing marked renal damage, including renal tubular epithelial cell flattening and casts in the tubular lumens, in all folic acid-treated mice. Severely dilated tubules with casts were observed in the kidneys of folic acid-treated Tg mice. (C) A representative image of immunohistochemical analysis with anti-α-SMA antibody (×400). No significant difference was observed between the kidneys of folic acid-treated WT and Tg mice. (D) The first representative image of semiquantitative scoring of tubular tissue injury showed more damage in folic acid-treated Tg mice compared with folic acid-treated WT mice and vehicle-treated Tg mice; however, the area fraction of positive α-SMA staining of α-SMA between folic acid-treated WT and Tg mice did not show a significant difference in the second representative image. (E) A representative image of quantitative data for albuminuria, as determined using Albuwell M ELISA kit (Exocell Inc., Philadelphia, PA, USA) and creatinine ELISA kit (Exocell Inc.). Albuminuria was higher in folic acid-treated Tg mice (n = 7) than in vehicle-treated WT (n = 7) and Tg mice (n = 7) and folic acid-treated WT mice (n = 7).
α-SMA, mouse α-smooth muscle actin; PAS, periodic acid Schiff; Tg, transgenic; UACR, the urinary albumin to creatinine ratio; WT, wild type.
*P < 0.05 compared with vehicle-treated WT mice, †P < 0.05 compared with vehicle-treated Tg mice, ‡P < 0.01 compared with folic acid-treated WT mice, §P < 0.05 compared with folic acid-treated WT mice, and ||P < 0.01 compared with vehicle-treated Tg mice; n, number of mice. Significance was analyzed using the Mann–Whitney U test.

