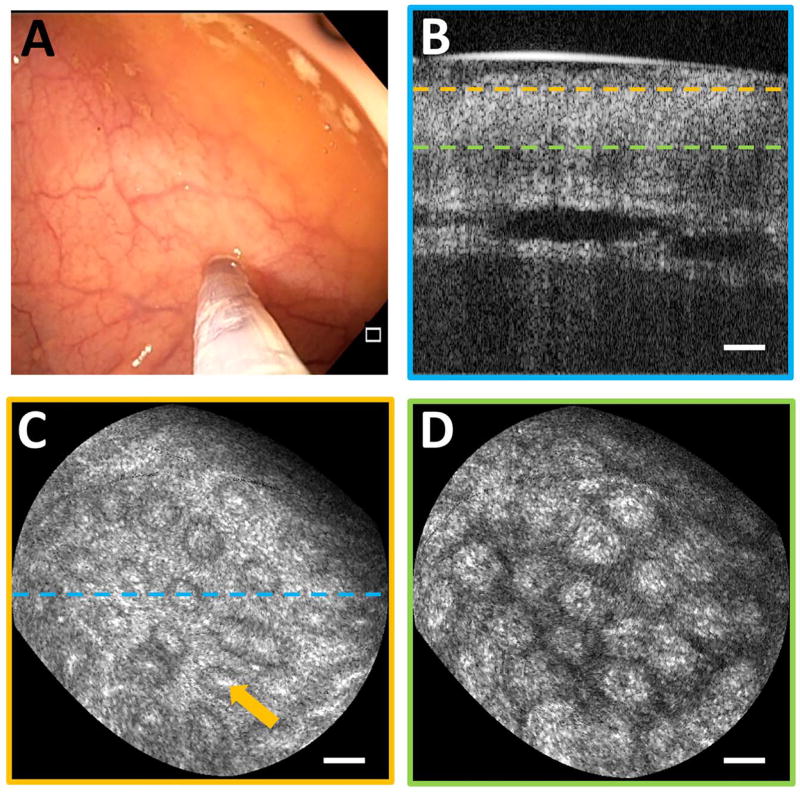
Fig. 3.
(A) Endoscopic image showing probe in contact with normal colonic mucosa. (B) Cross-section of OCT volume acquired. En face OCT slices of 40 µm depth mean intensity projection at (C) 40 µm depth and (D) 200 µm depth in tissue (dashed lines indicate depth) showing crypt lumens (orange arrow). Scale bars 100 µm.

