
Fig. 5. P2X7 receptor inhibition decreases the number of apoptotic cells in the liver from septic WT or CD39−/− mice.
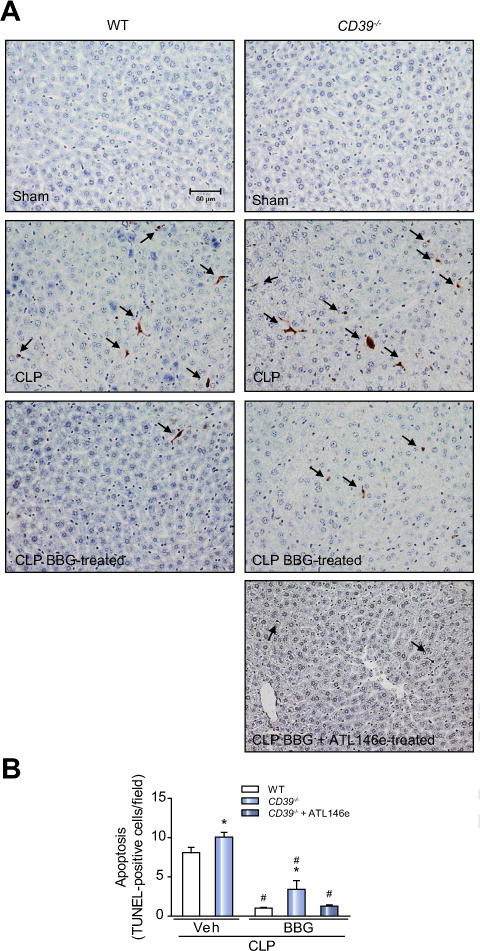
The liver was harvested 24 h after surgery. (A) Photomicrographs show the hepatic TUNEL-positive cells (arrows) in septic WT and CD39−/− mice. (B) Number of TUNEL-positive cells per field. Values represent mean ± SEM of four animals per group, considering five random fields per mice. Data are expressed as mean ± SEM of two independent experiments (n = 6) analyzed by one-way ANOVA, Turkey tests. Statistically significant differences between Sham and CLP, and between CLP groups (CLP vehicle vs. CLP BBG, CLP vehicle vs. CLP BBG + ATL146e) are indicated by asterisks (*, p <0.05) and by the number sign (#, p <0.05), respectively.