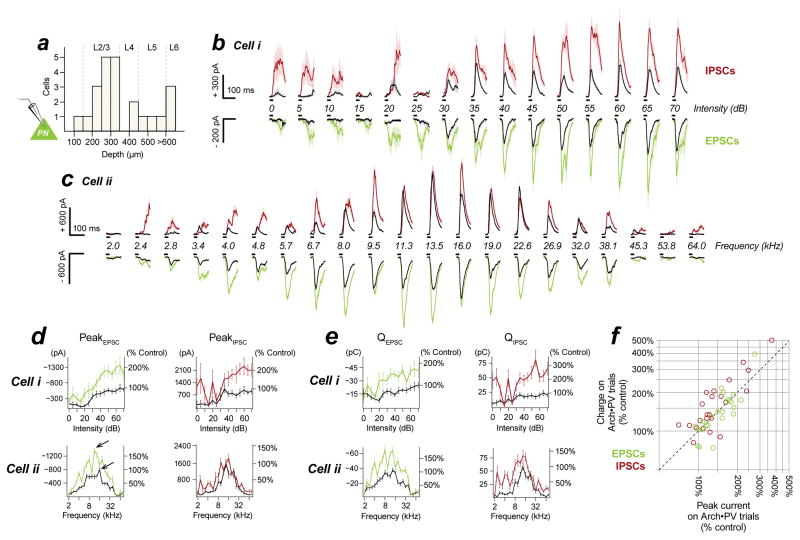
Figure 2. PV+ suppression increases excitation and inhibition to PNs.
a, We recorded from cells in all layers (n=23 cells recorded in voltage-clamp). Depths binned at 50 μm. b–c, Sound-evoked EPSCs and IPSCs for two example PNs. Black, control trials; red/green, Arch•PV trials, mean±SEM. Upper red/black traces are IPSCs (inhibition); lower green/black traces are EPSCs (excitation). Sound presentation indicated by black bars. The amplitude of excitatory and inhibitory synaptic currents increased on Arch•PV trials. This was true for most neurons (for EPSCs, 20/23 cells; IPSCs, 15/23 cells). In no cells did we observe a significant decrease in inhibition. Stimuli: (a) 25 ms WN from 0–70 dB (5 dB steps), 15±2 paired repetitions; (b) 25 ms tones from 2–80 kHz (5 frequencies/octave) at 60 dB, 11±2 paired repetitions. Note separate scales for EPSCs and IPSCs.d–e, Changes in peak current (d) and synaptic charge (e) for the example cells in panels b–c; EPSCs at left, IPSCs at right. Raw values are expressed as a percentage of the maximum control response. Arrows in (d) show the maximum response evoked by a single stimulus in the control and Arch•PV conditions. f, Summary of changes in peak current amplitudes and synaptic charge (n=23 neurons; IPSCs in red, EPSCs in green). Values are normalized to the maximum trial-averaged response, across stimuli, on control trials (see arrows for the example in panel d).

