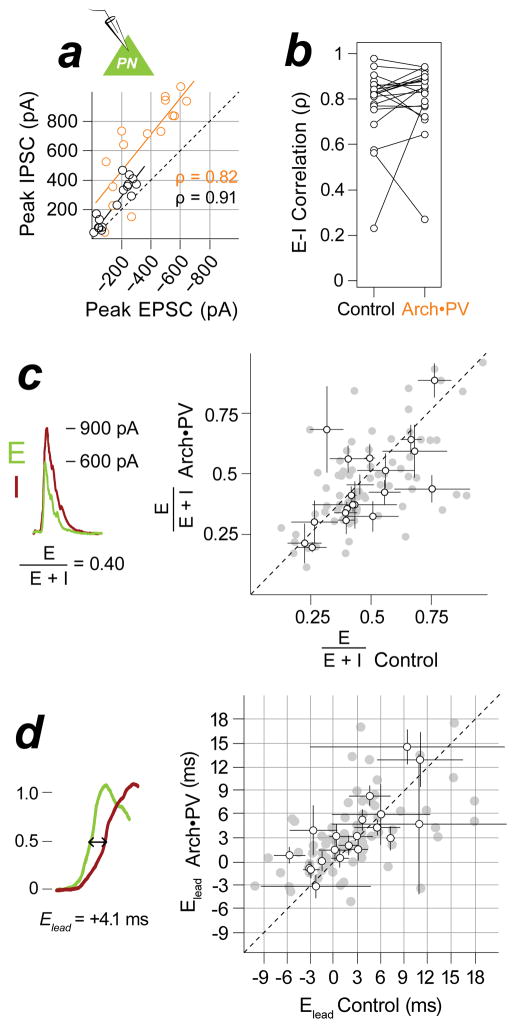
Figure 3. Excitatory-inhibitory balance and timing are preserved.
a, E-I co-tuning. EPSC and IPSC responses to tones for example cell in Figure 2c, means across trials. Control, black; Arch•PV, orange. EPSC and IPSC amplitudes were highly correlated across stimuli on control trials (Spearman’s ρ=0.91, p<0.05). The amplitude of evoked currents approximately doubled on Arch•PV trials but EPSCs and IPSCs remained co-tuned (ρ=0.82, p<0.05). b, Group data for E-I correlation (ρ), for n=20 cells showing a significant change in excitatory input on Arch•PV trials. c, E-I ratio. Left: We computed the ratio E/(E+I) from the peak amplitude of trial-averaged currents, as illustrated. Right: Comparison of amplitude ratios on control and Arch•PV trials, n=20 cells. Grey points: E/(E+I) for best stimuli (75th percentile), black points: median±IQR across best stimuli for each cell. d, E-I delay. Left: We computed the excitatory lead time Elead from trial-averaged currents, as illustrated: Elead = inhibitory latency minus excitatory latency, measured at half maximum. Right: Grey points: Elead for best stimuli, black points: median±IQR across best stimuli for each cell, n=20 cells.

