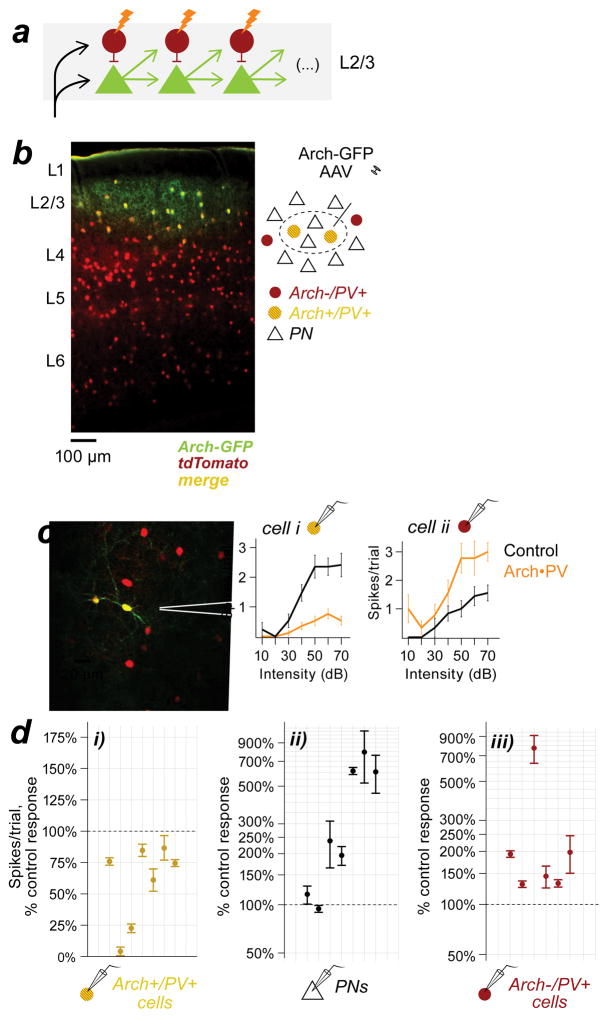
Figure 5. Focal suppression of PV+ neurons in L2/3 increases PV+ activity in the same layer.
a, Feed-forward circuit shown in 4g, re-oriented to show the predicted effects of PV+ suppression within a layer. b, Coronal section from a PV-Cre/tdTomato mouse injected with cre-dependent Arch-GFP AAV. All PV+ neurons expressed tdTomato (red) but only infected PV+ cells in L2/3 expressed Arch-GFP (green). Section thickness, 50 μm; scale bar, 100 μm. Inset: cartoon of the Arch expression site (dashed ellipse). c, Example recordings from neighboring L2/3 PV+ cells at the edge of the expression site. Left: Both neurons expressed tdTomato (red); cell i also expressed Arch-GFP (green). Right: Trial-averaged spike counts on control and Arch•PV trials. The Arch-positive PV+ cell (i) was suppressed on laser trials, whereas the Arch-negative PV+ cell (ii) showed increased spiking responses. d, Sound-evoked spiking responses on Arch•PV trials, as a percentage of the control response. Group data from n=5 mice. di, Arch-positive PV+ cells were suppressed on laser trials (n=6 recordings). dii, Neighboring PNs (n=7) showed increased responses on laser trials. diii, Arch-negative PV+ cells at the edge of the expression site (n=7) showed increased responses on laser trials. Points show the median change across best stimuli; error bars, IQR. Stimuli: WN, 0–70 dB.

