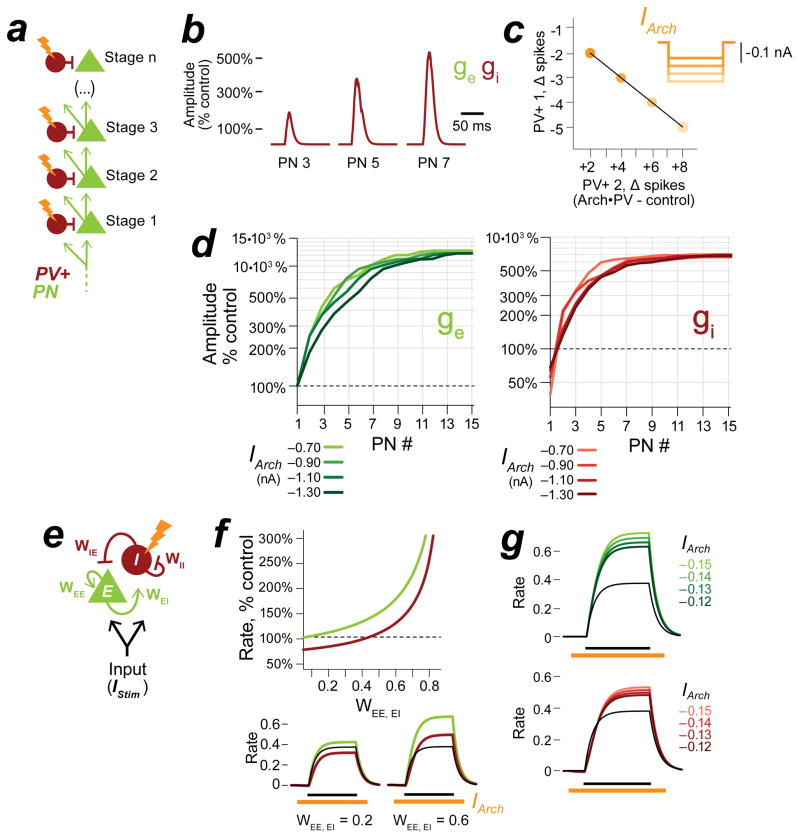
Figure 6. Network models for excitatory-inhibitory rebalancing.
a, Cascaded Feed Forward (CFF) network model. b, Excitatory and inhibitory input to PNs in stages 3, 5, 7 with PV+ suppression (IArch=−0.50 nA). Excitatory conductance, ge (green); inhibitory conductance, gi (red). c, The increase in inhibition is not suppressed by stronger Arch currents. Plot shows the change in spiking for PV+ cells in layers 1 and 2 with increasing suppression (IArch = −0.6 to −1.8 nA). d, Excitatory and inhibitory input to PNs with increasing suppression, stages 1–15. With stronger suppression, synaptic inputs increase in magnitude but remain balanced. e, Inhibition Stabilized Network (ISN) model. The ISN consists of a pool of interconnected excitatory (E) and inhibitory neurons (I) with weighted connections WEE, WEI, WIE, WII. The average firing rates of the pools are represented as continuous variables, rE and rI. See STAR Methods for details. When recurrent connectivity is strong (all weights = 1.0), a brief stimulus IStim elicits a balanced excitatory and inhibitory response (a single black line in 6f–g). f, In f–g, a suppressive current IArch is applied to the inhibitory pool. The strength of recurrent excitation (WEE, EI) is varied, all other parameters are fixed (IStim = 0.5, duration 800 ms, IArc h = −0.13, duration 1200 ms). Top: Plot of the excitatory and inhibitory response (peak firing rate) for increasing values of WEE, EI. Bottom: Example traces. When excitatory connections are weak (WEE, EI = 0.2), IArch suppresses the inhibitory response below control levels. When excitatory connections are strong (WEE, EI = 0.6), the increase in excitatory input to the inhibitory pool outweighs the suppressive current and produces a net increase in the inhibitory response. Control response is shown in black, Arch•PV response is shown in red and green. g, Excitatory and inhibitory rates with increasing suppression; WEE, EI = 0.75.

