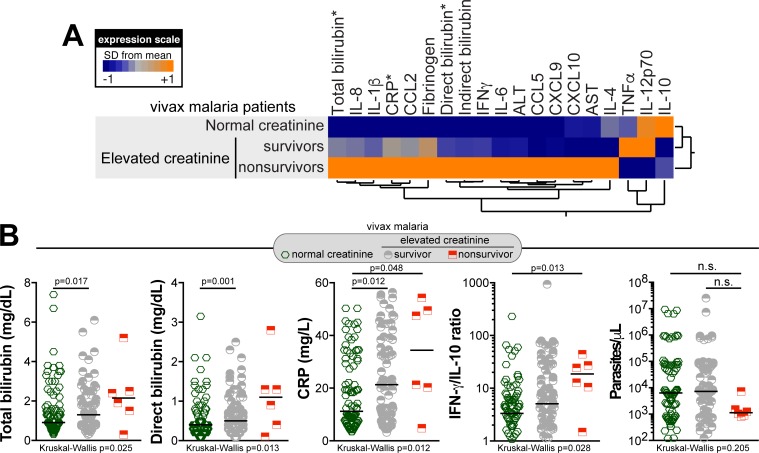
Fig 3. Inflammatory profile of patients with acute Plasmodium vivax malaria according to serum creatinine levels and outcome.
(A) Overall profile of plasma concentrations of several biochemical parameters, cytokines and chemokines in patients presenting creatinine levels within the normal range (n = 90) as well as in vivax malaria survivors (n = 83) and nonsurvivors (n = 6) presenting abnormally elevated creatinine levels. Data were processed using hierarchical cluster analysis (Ward’s method) with 100X bootstrap. Dendograms represent hierarchical distance. Asterisks indicate parameters which were statistically different between the groups of malaria patients with normal or elevated creatinine levels assessed using the Kruskall-Wallis test. Scatter plots of these parameters are shown in (B). The IFN-γ/IL-10 ratio, which has been shown to correlate with the inflammatory imbalance in vivax malaria (4), and parasitemia levels were also compared between the study groups. Bars represent median values.

