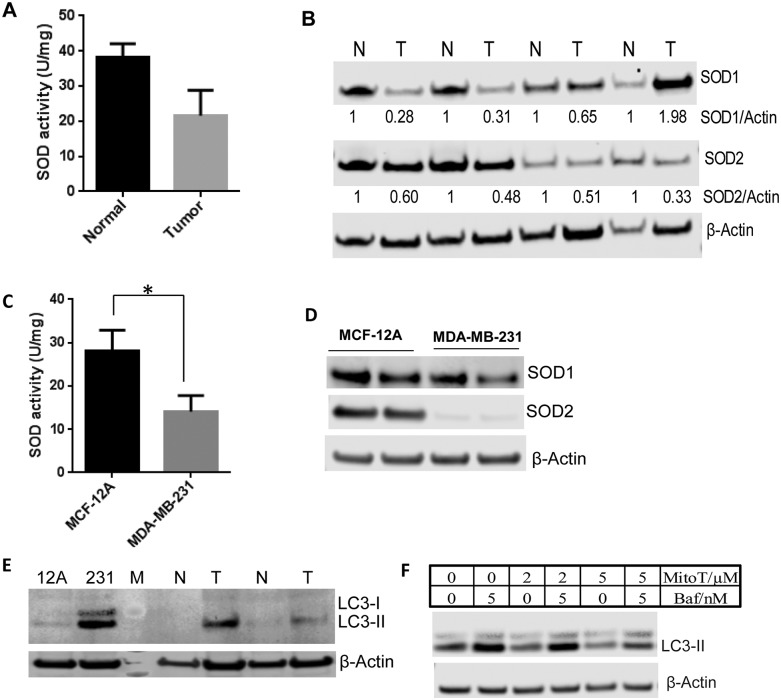
Fig 4. Determination of antioxidant status and autophagy.
(A) Quantification of SOD activity in the tumor and adjacent healthy tissue. (B) Representative western blots for SOD1 and SOD2 proteins in breast tumor and adjacent healthy tissue. (C) Quantification of SOD activity in breast cancer MDA-MB-231 and non-cancerous MCF-12A cells. (D) Representative western blots for SOD1 and SOD2 proteins in breast cancer MDA-MB-231 and non-cancerous MCF-12A cell lines. (E) Representative western blot for the basal level of LC3-II in non-cancerous MCF-12A cell line, breast cancer MDA-MB-231 cell line, breast tumor tissue, and adjacent healthy tissue. (F) Representative western blot to demonstrate the effect of antioxidant Mito-Tempol (MitoT) on autophagy using MDA-MB-231 cell lines. β-Actin was used as a loading control in all western blots. M = protein marker, N = adjacent healthy tissue, T = breast tumor tissue, baf = bafilomycin A1, MitoT = Mito-Tempol.

