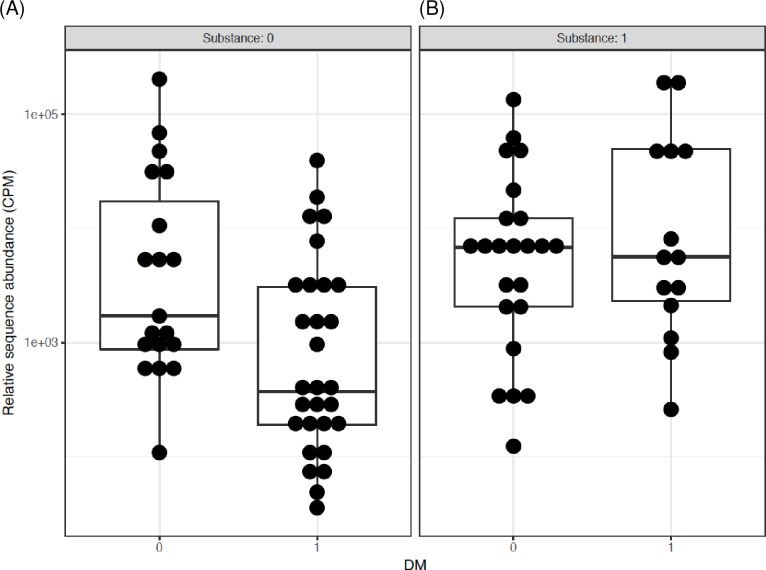
Fig 3. The interactive influence of T2D on Bifidobacterium genus in men using or not using opioids.
Data are pair-wise comparisons for the relative sequence abundance of Bifidobacterium. The differential subgroup analysis was done using edgeR, the false discovery rate (FDR) adjusted p values (q values) were calculated using the Benjamini-Hochberg FDR correction. Abbreviations: 0/1 = factor absent/present. CPM = count per million, DM = type 2 diabetes, Substance = opioids. (A) 2.3 log2 fold decrease in subjects with vs. without T2D when both groups are not using opioids (q = 0.03). (B) No difference between without vs. with T2D when both groups are using opioids.

