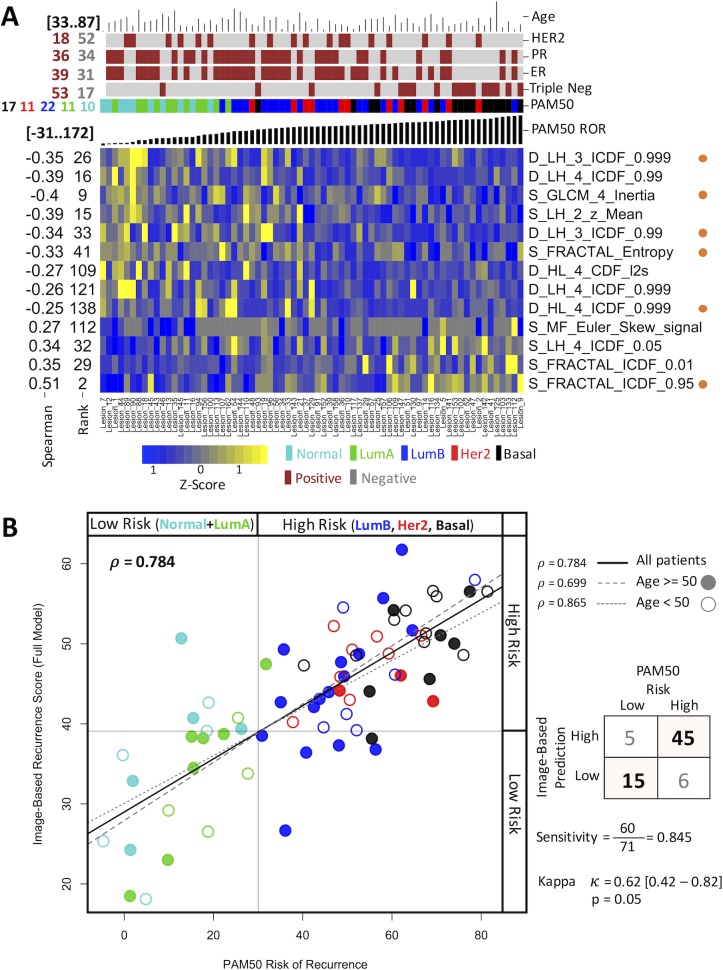
Fig 4. Characteristics of the model obtained for PAM50.
(A) A heat map representation of the features associated to risk from PAM50 ROR. The figure shows the features selected by LASSO (vertical axis) and their univariate Spearman coefficient and rank along samples (horizontal axis) ordered by the PAM50 ROR score. The top of the figure includes common clinical indicators. The image data was scaled to z-score to nightlight differences. Orange dots at the right represent features also present in the OncotypeDX model. (B) Comparison of the estimated PAM50 recurrence score with that of the score predicted by the image model in (A). Each dot represents a sample. Colors represent subtypes and filled or open circles represent younger or older patients.

