Fig 5.
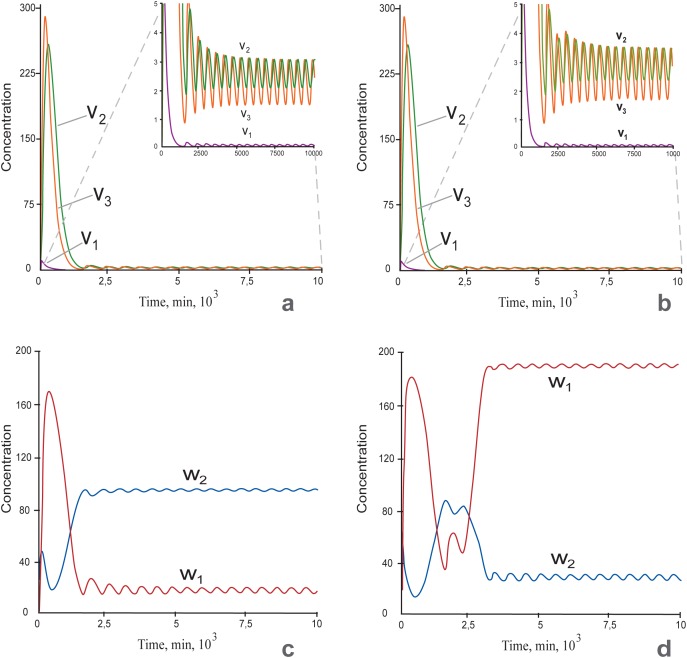
a-b: Time series of mRNA and protein expressions for Nanog at h = 10: v1—Nanog mRNA concentration, v2 –Nanog protein concentration in the nucleus, v3—Nanog protein concentration in the cytoplasm; The insets in Fig 5A and 5B represent the same curves as on the main part, but with a zoomed scale of the y-axis. c-d: Time series for concentrations of pluripotent (w1) and differentiation (w2) factors. Concentration oscillations of Nanog and pluripotent/differentiation factors occurred at A = 0.2 (a, c) and A = 0.3 (b, d). The other parameters were fixed. c: The pluripotent factors w1 were suppressed and the differentiation factors w2 were expressed. This state corresponds to differentiation. d: Pluripotent factors were highly expressed, and differentiation factors were suppressed. This state corresponds to pluripotency.

