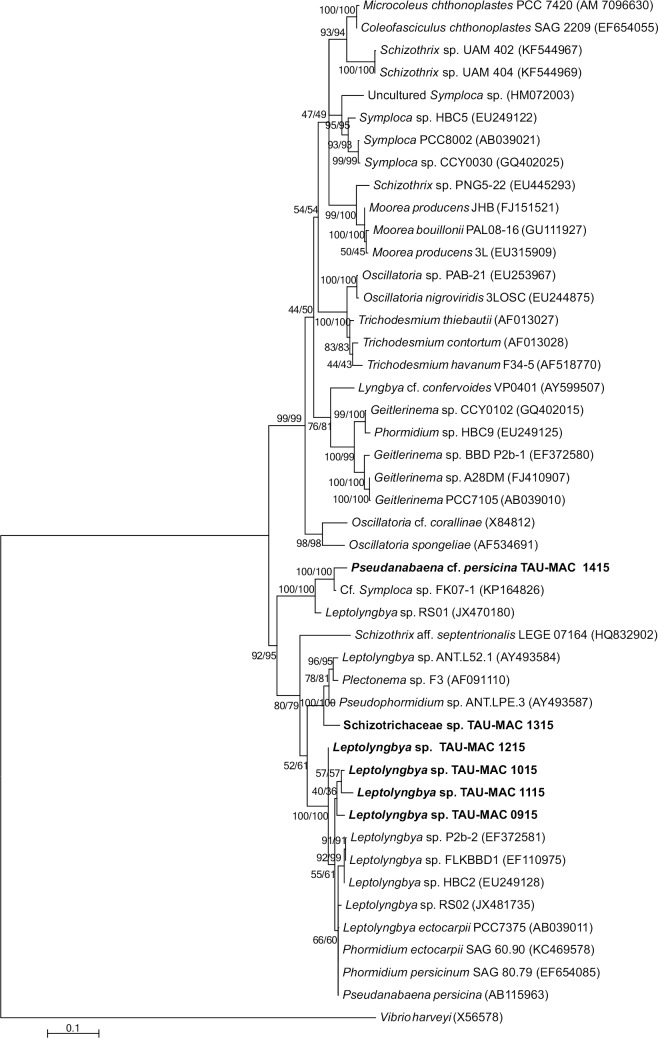
Fig 5. Phylogenetic tree based on 16S rRNA gene sequences of filamentous cyanobacteria reconstructed using the Maximum-Likelihood (ML) method.
Numbers above branches indicate the bootstrap value (as percentages of 1,000 replications) for NJ/ML methods. The topologies of ML and NJ analyses were the same. Strains of the present study are indicated in bold, GenBank accession numbers are indicated in brackets. Bar represents 0.1 nucleotide substitutions per site.

