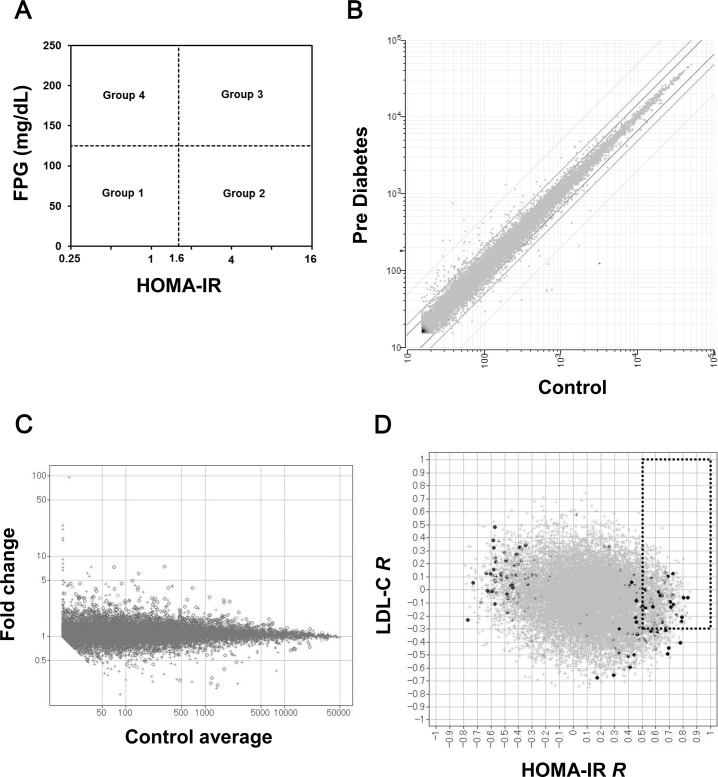
Fig 1. Exploration of novel target genes associated with insulin resistance by comprehensive gene expression analysis in human liver biopsy samples.
(A) Human subjects were grouped into four groups based on characteristics of insulin resistance and blood glucose. Subjects with high fasting plasma glucose (FPG) (≥ 125 mg/dL) and high HOMA-IR (≥ 1.6) were assigned to the Diabetes group or Group 3. Subjects with normal FPG and high HOMA-IR were assigned to the Pre-Diabetes group or Group 2. Subjects with low FPG and low HOMA-IR were assigned to the Control group or Group 1. (B) The expression data from approximately 50000 probes set on the DNA chip were quantified. The mean expression level values in Group 1 (control) and Group 2 (pre-diabetes) for each probe were plotted. (C) The fold change of the mean value in Group 2 (n = 9) relative to that in Group 1 (n = 6) for each probe was calculated (Group 2/Group 1 ratio) and plotted against the mean signal in Group 1 for each probe. (D) Spearman’s rank correlation coefficients (R) of signals for each probe versus HOMA-IR were calculated. Additionally, the R values of signals for each probe versus low density lipoprotein (LDL) cholesterol were plotted against R of HOMA-IR. Probes with R versus HOMA-IR higher than 0.5 and with R of LDL-C higher than −0.3 were selected.

