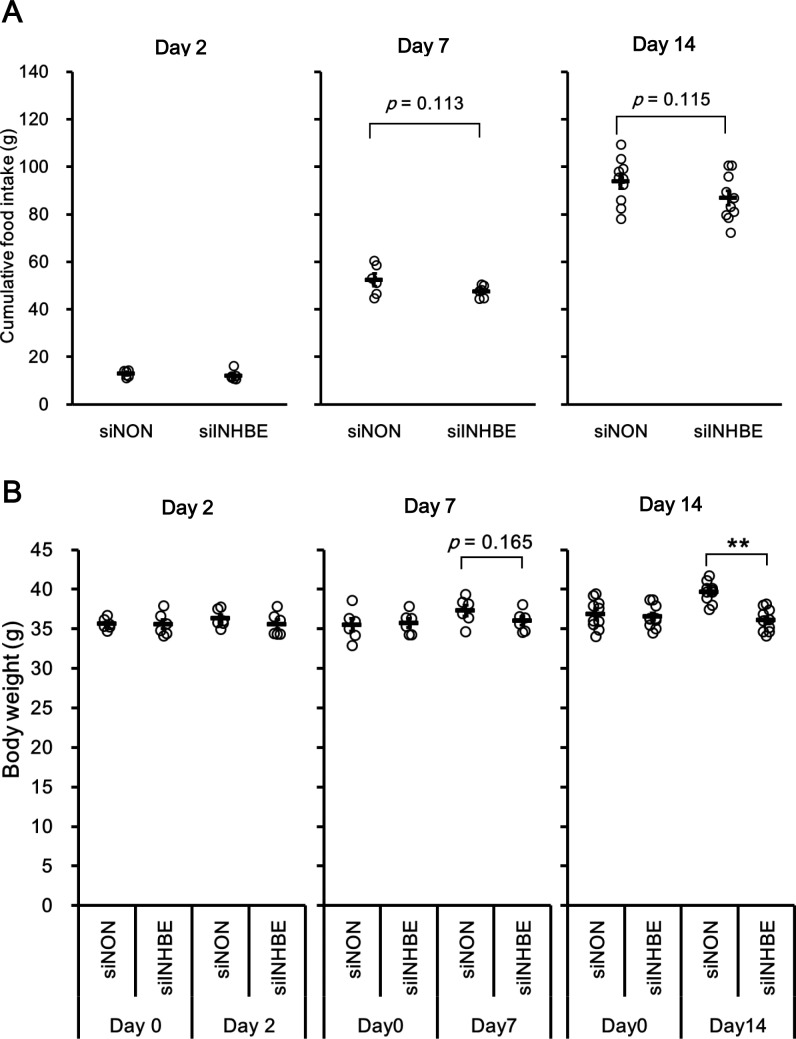
Fig 4. Knock down of hepatic Inhbe mRNA in db/db mice suppressed body weight gain.
(A) Cumulative food intake in the siNON- and siINHBE-treated groups on days 2 (n = 6 for each group), 7 (n = 6 for each group), and 14 (n = 10 for each group) after the first dosing. Cumulative food intake of same mouse as ones in Fig 3E is indicated at each time point which was nearest in sacrifice of animals. (B) Body weight in the siNON- and siINHBE-treated groups on days 2 (n = 6 for each group), 7 (n = 6 for each group), and 14 (n = 10 for each group) after the first dosing. Body weight of same mouse as ones in Fig 3E is obtained at point in time nearest to the time when the animals were sacrificed and at time point before first dosing (Day0). Data are expressed as mean ± SEM. Differences between the two groups were assessed by unpaired t-test. **: P < 0.01.

