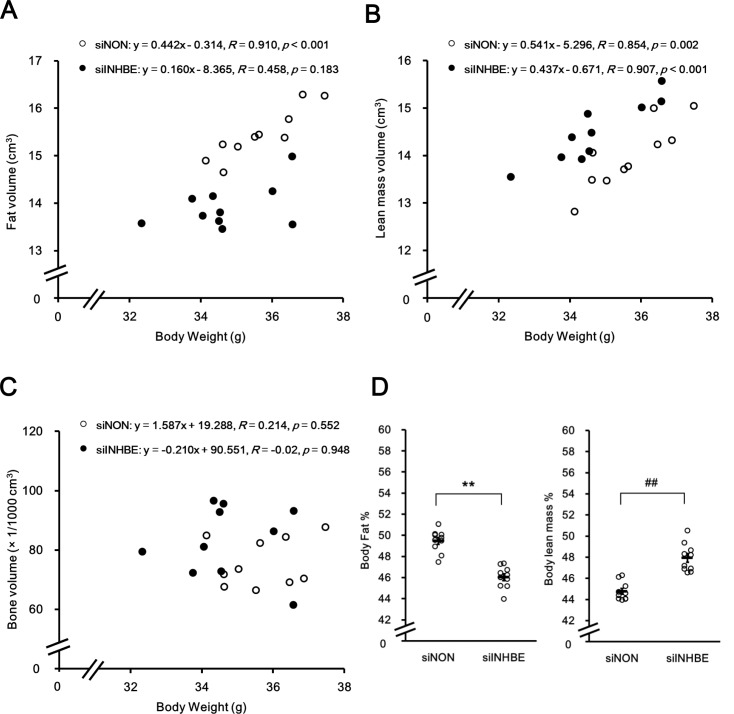
Fig 5. Knock down of hepatic Inhbe mRNA in db/db mice altered body composition.
Body fat, lean mass, and bone volumes were measured by CT analysis in the siNON- (n = 10) and siINHBE-treated groups (n = 10) on day 10 or 11 after the first dosing. Body fat volume (A), body lean mass volume (B), and bone volume (C) values for each animal were plotted versus body weight values. Body fat volume (A) and body lean mass volume (B) in the siINHBE- versus siNON-treated group were significantly decreased and increased, respectively, by analysis of covariance (P < 0.01). (D) Body fat and lean mass percentages were calculated by dividing body fat volume and body lean mass volume by total volume, respectively. Data are expressed as mean ± SEM of 10 animals. Difference between the two groups in body fat percentages in (D) was assessed by unpaired t-test. Difference between the two groups in body lean mass percentages in (D) was assessed by Mann-Whitney U test (D). **: P < 0.01 (for body fat percentages), ##: P < 0.01 (for body lean mass percentages).

