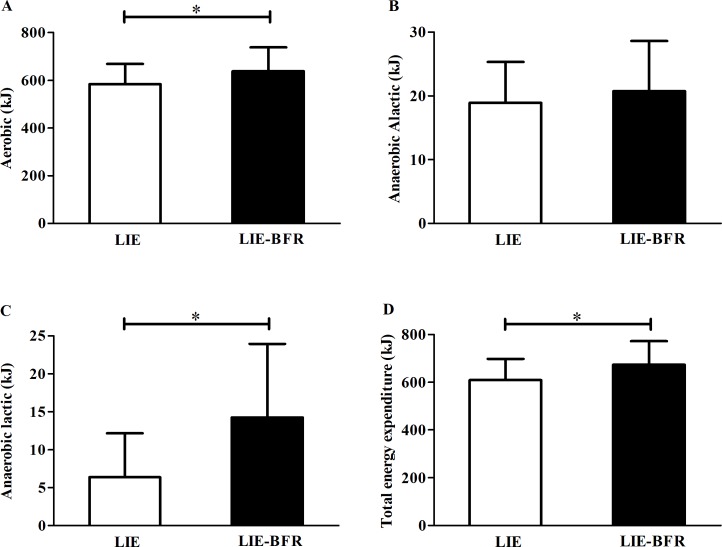
Fig 1.
Aerobic metabolism (A), anaerobic alactic metabolism (B), anaerobic lactic metabolism (C), and total energy expenditure (D) during low intensity endurance exercise (LIE) and low intensity endurance exercise with blood flow restriction (LIE-BFR). Values are mean ± SD (n = 12). * Significant difference between groups (P ≤ 0.05).

